[Kubernetes](Monitoring)Install prometheus for kubernetes monitoring with helm chart
업데이트:
Purpose
Monitor and alert kubernetes cluster
Prometheus architecture
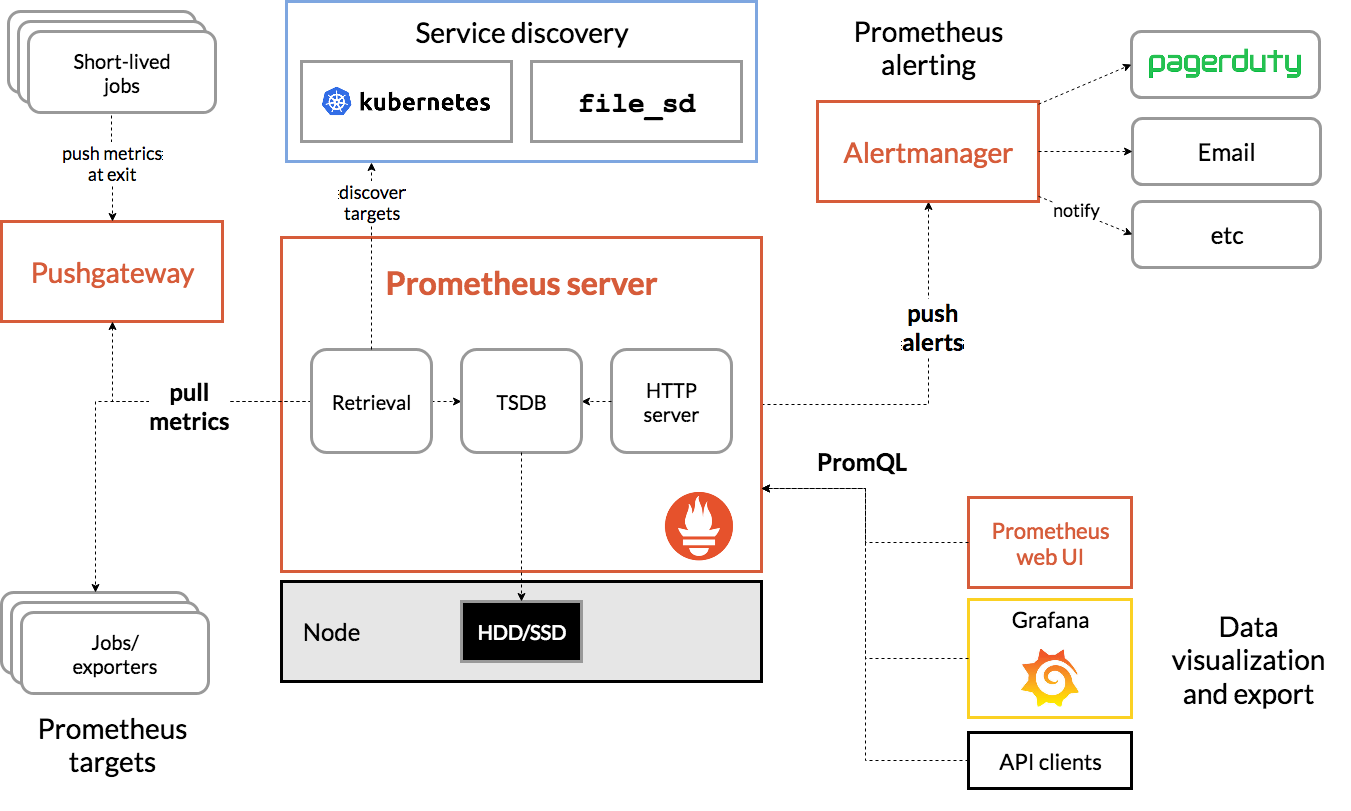
Prometheus server
시계열 데이터를 수집해서 저장
Client libarary
어플리케이션을 개발할 때 프로메테우스에서 데이터를 수집하도록 만드는 라이브러리
Push gateway
클라이언트에서 직접 프로메테우스로 데이터를 보낼 때 받는 역할
Exporter
프로메테우스 클라이언트 라이브러리를 내장해 만들지 않은 어플리케이션에서 데이터를 수집. 100개가 넘는 다양한 익스포터가 있으므로 거의 모든 어플리케이션에서 데이터를 수집할 수 있다.
Alert manager
알람을 보낼 때 중복 처리, 그룹화 등을 알람을 어디로 보낼지 관리한다.
Helm chart를 활용한 Prometheus & Grafana Kubernetes에 구성하기
1. Chart Download
There are 2 ways to install helm chart
## 1 git clone helm chart
git clone https://github.com/helm/charts.git
cd charts/stable
## 2 fetch helm chart
helm fetch stable/prometheus-operator
2. compile chart
## lint : compile
helm lint prometheus-operator
==> Linting prometheus-operator
[WARNING] templates/prometheus-operator/admission-webhooks/mutatingWebhookConfiguration.yaml: admissionregistration.k8s.io/v1beta1 MutatingWebhookConfiguration is deprecated in v1.16+, unavailable in v1.22+; use admissionregistration.k8s.io/v1 MutatingWebhookConfiguration
[WARNING] templates/prometheus-operator/admission-webhooks/validatingWebhookConfiguration.yaml: admissionregistration.k8s.io/v1beta1 ValidatingWebhookConfiguration is deprecated in v1.16+, unavailable in v1.22+; use admissionregistration.k8s.io/v1 ValidatingWebhookConfiguration
[WARNING] /root/workspace/charts/stable/prometheus-operator: chart directory is missing these dependencies: kube-state-metrics,prometheus-node-exporter,grafana

1 chart(s) linted, 0 chart(s) failed
→ kube-state-metrics, prometheus-node-exporter, grafana 와 의존성이 있다.
Add dependecies
root@jv0535 [~/workspace/charts/stable]helm package kube-state-metrics
Successfully packaged chart and saved it to: /root/workspace/charts/stable/kube-state-metrics-2.9.4.tgz
root@jv0535 [~/workspace/charts/stable]helm package prometheus-node-exporter
Successfully packaged chart and saved it to: /root/workspace/charts/stable/prometheus-node-exporter-1.11.2.tgz
root@jv0535 [~/workspace/charts/stable]helm package grafana
Successfully packaged chart and saved it to: /root/workspace/charts/stable/grafana-5.5.7.tgz
root@jv0535 [~/workspace/charts/stable]mkdir -v ./prometheus-operator/charts
mkdir: created directory ‘./prometheus-operator/charts’
root@jv0535 [~/workspace/charts/stable]mv *.tgz ./prometheus-operator/charts/
3. Config Volume
There are 2 ways to use volume
3.1 DynamicPVC
Before use it, you have to set up for dynamicpvc
Edit value.yaml
Change storageClassName to the name set by dynamicpvc
## Prometheus
storageSpec:
      volumeClaimTemplate:
        spec:
          storageClassName: join-nfs-storageclass
          accessModes: ["ReadWriteOnce"]
          resources:
            requests:
              storage: 10Gi

## Alertmanager
storage:
     volumeClaimTemplate:
       spec:
         storageClassName: join-nfs-storageclass
         accessModes: ["ReadWriteOnce"]
         resources:
           requests:
             storage: 10Gi
3.2 Create pv ( using hostPath )
the path below needs appropriate authorit
apiVersion: v1
kind: PersistentVolume
metadata:
  name: prometheus-alertmanager
spec:
  capacity:
    storage: 20Gi
  volumeMode: Filesystem
  accessModes:
    - ReadWriteOnce
  persistentVolumeReclaimPolicy: Retain
  hostPath: # 내용에 맞게 변경
    path: /k8s-nas/prometheus/alertmanager
---
apiVersion: v1
kind: PersistentVolume
metadata:
  name: prometheus-grafana
spec:
  capacity:
    storage: 15Gi
  volumeMode: Filesystem
  accessModes:
    - ReadWriteOnce
  persistentVolumeReclaimPolicy: Retain
  hostPath: # 내용에 맞게 변경
    path: /k8s-nas/prometheus/grafana
Edit value.yaml
Mapping volumeName to pv name
storage: #{}
     volumeClaimTemplate:
       spec:
         #storageClassName: gluster
         accessModes: ["ReadWriteOnce"]
         resources:
           requests:
             storage: 20Gi
         volumeName: prometheus-alertmanager

---
storageSpec: #{}
      volumeClaimTemplate:
        spec:
    #      storageClassName: gluster
          accessModes: ["ReadWriteOnce"]
          resources:
            requests:
              storage: 15Gi
          volumeName: prometheus-grafana
4. Add label ( options )
when you want to use specifc node, add node label and edit below value
root@jv0535 [~/workspace/yaml/prometheus/prometheus-operator]grep -i '^\ *nodeselector' -A 1 -B 1 values.yaml
    ##
    nodeSelector: {}

--
      podAnnotations: {}
      nodeSelector: {}
      affinity: {}
--
  ##
  nodeSelector: {}

--
    ##
    nodeSelector: {}
5. Chart Deploy
root@jv0535 [~/workspace/yaml/prometheus-operator]helm install prometheus . -n prometheus
댓글남기기